Aplicaciones para Medir el Uso del Tiempo Frente a la Pantalla: Controla tu Consumo Digital
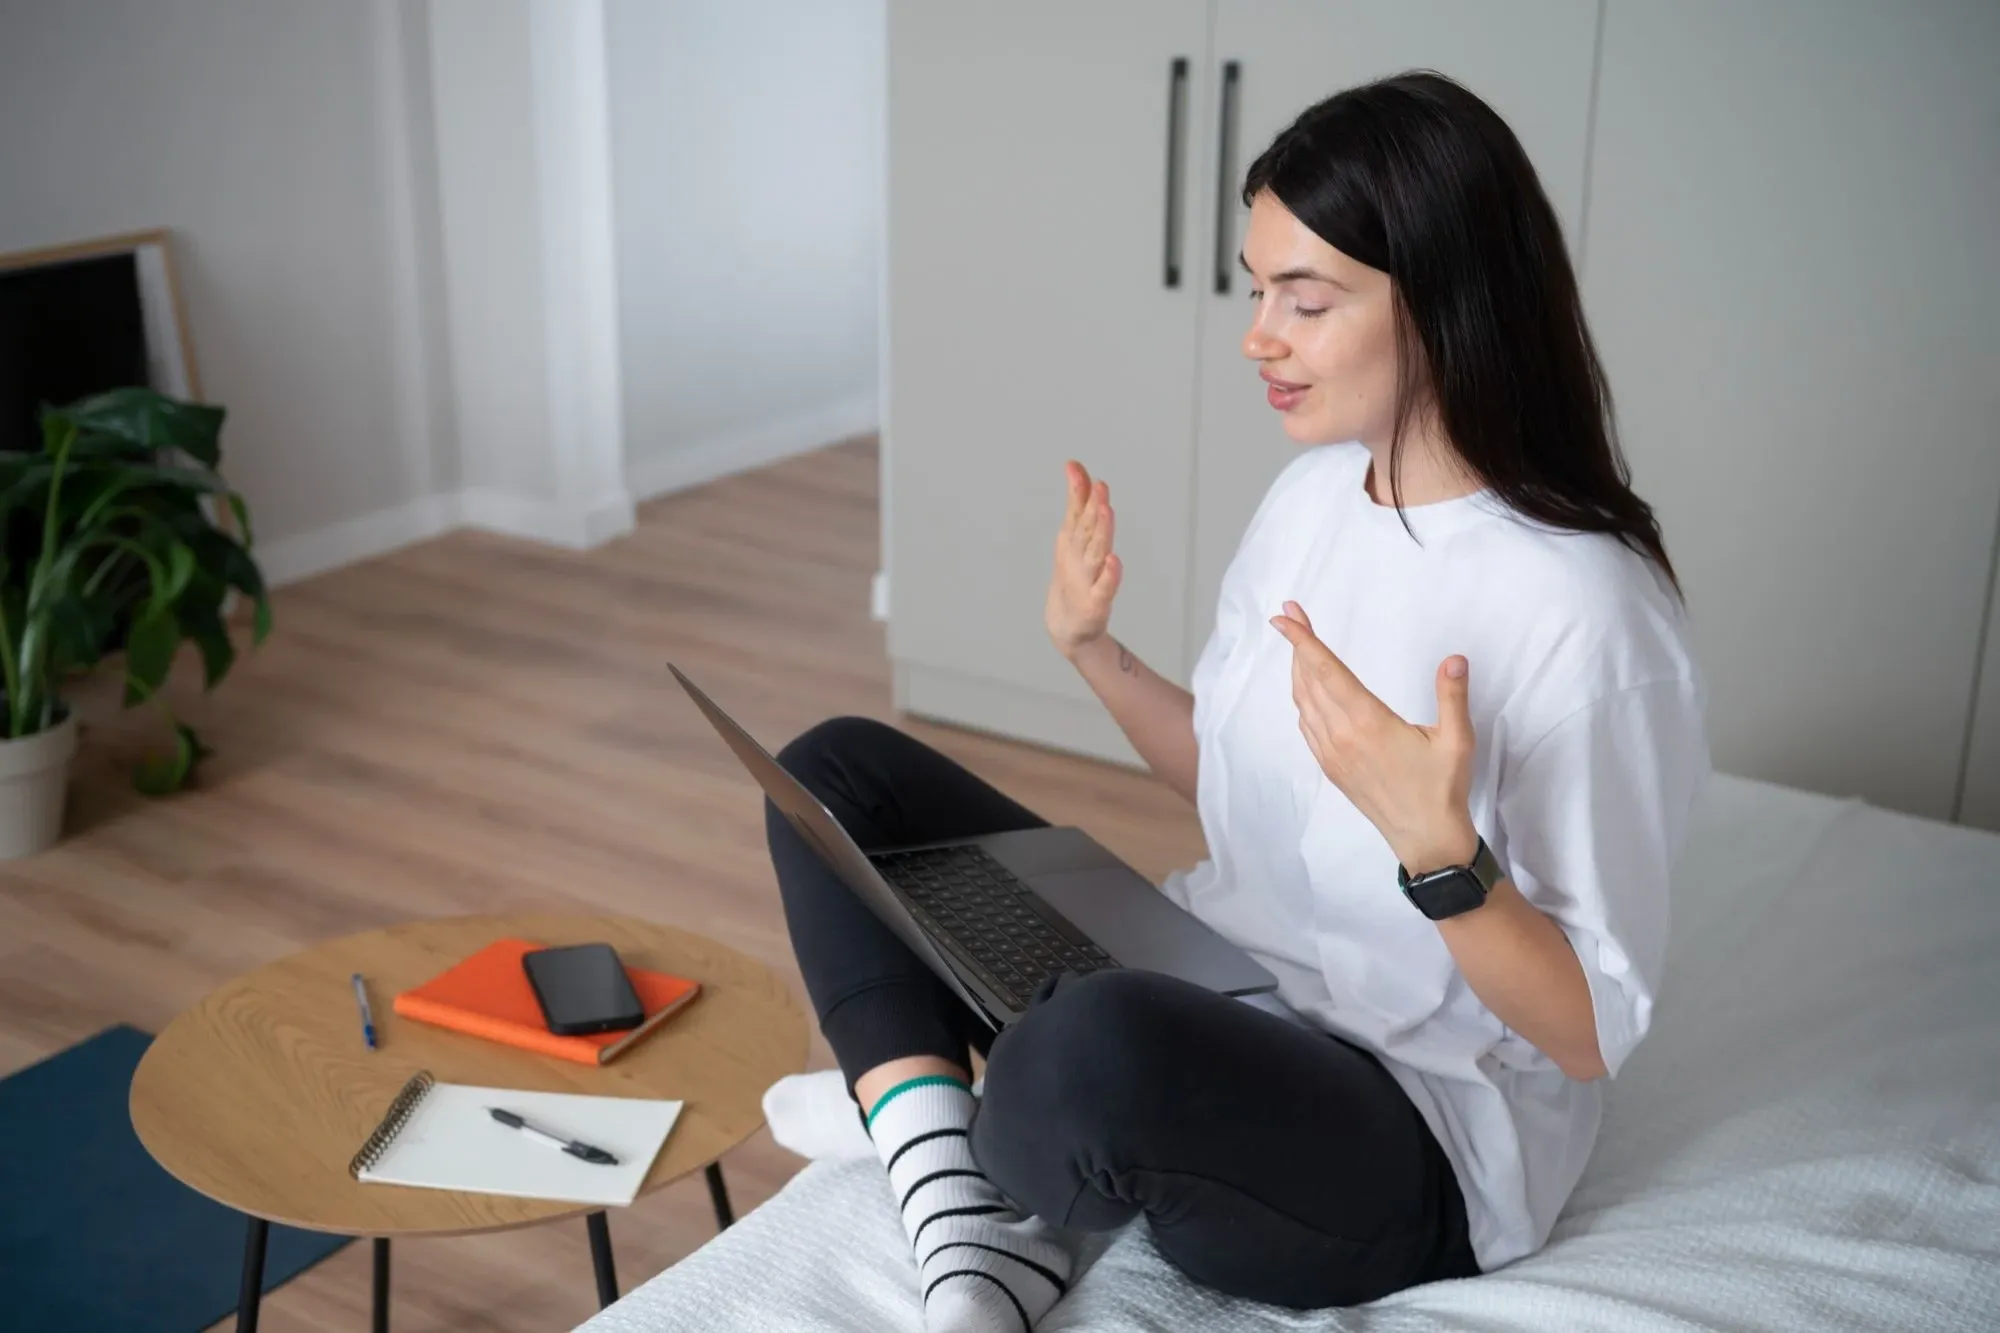
En la era digital, pasamos una cantidad significativa de tiempo frente a las pantallas de nuestros dispositivos. Ya sea revisando redes sociales, trabajando, jugando o simplemente navegando por internet, es fácil perder la noción del tiempo y desarrollar una dependencia poco saludable. Para combatir este problema y recuperar el control de nuestro tiempo, existen numerosas aplicaciones diseñadas para medir con precisión el uso que le damos a nuestras pantallas. Estas herramientas no solo nos muestran cuánto tiempo pasamos frente a la pantalla, sino que también ofrecen funcionalidades adicionales para ayudarnos a gestionar mejor nuestro consumo digital.